
Accelerate Success with AI-Powered Test Automation – Smarter, Faster, Flawless
Start free trial
Product lifecycle and quality fluctuations
In the world of agile development, maintaining high levels of quality can become a major headache, due to its incremental and iterative approach. There are times when a time crunch may lead to certain compromises which allow a minuscule amount of defects to reach the deployment stage. Multiple releases of the product may not be at the same level of quality over a period of time.
Let us understand how it happens with the aid of the following figure, which depicts how the quality level of an organization can vary over time for a particular product or service.
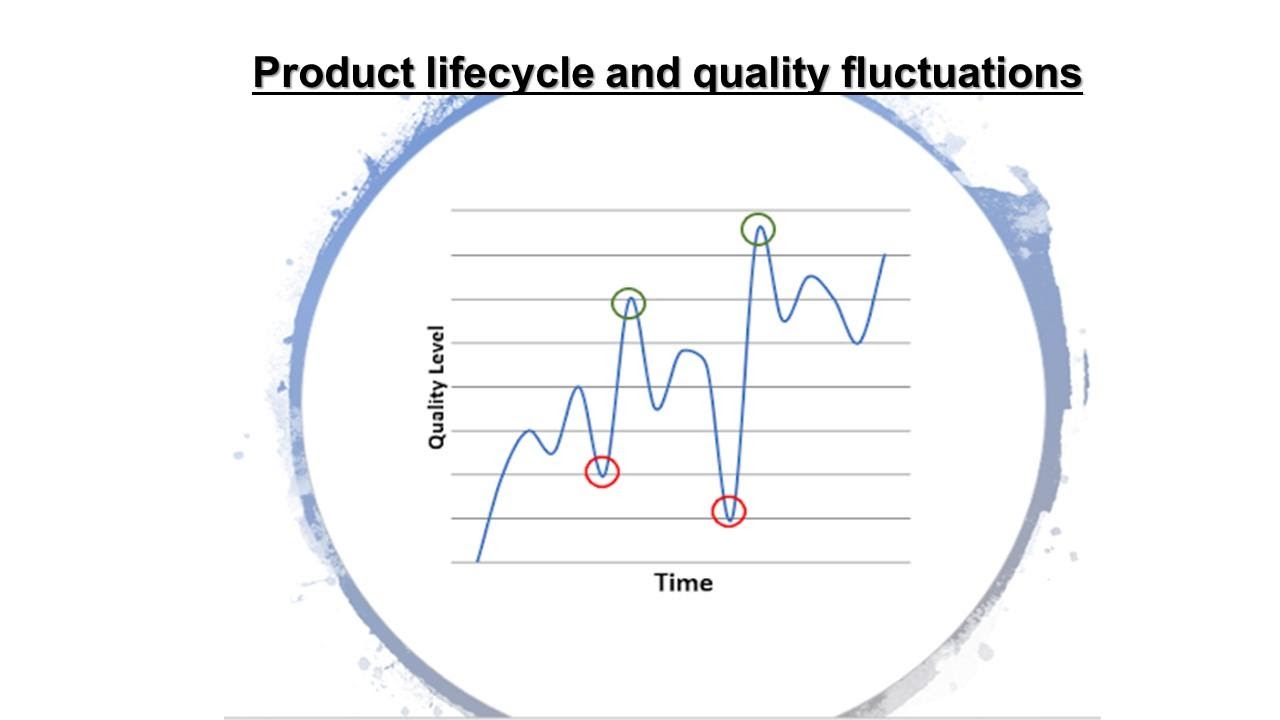
The first red circle represents when the quality gets really bad. That mobilizes the teams and there is a concerted effort to improve and it leads to quality hitting the first green circle, i.e. significant improvement. However, if the organization’s QA process is not well defined, then the quality level starts dropping again once the crisis is over. Accrued technical debts lead to the second crisis point. Once again it triggers a reactive approach by putting in efforts for damage control which results in the second green circle in the above figure. And this cycle just keeps repeating till some concrete steps are taken.
However, the problem is that as the surface area of the product increases, that is, as many more features are created, over time the quality swings become larger in magnitude. Eventually, you reach a point where the only solution is to archive the current version of the product or service and create a brand-new version. It is also an opportunity to introspect and check if something is missing in the quality assurance policies and processes of the organization.
Ideally, the quality fluctuations should be managed by having well-defined strategies for testing and analyzing the test results. The next section covers three defect-centric metrics that can prove useful in quality measurement and assurance.
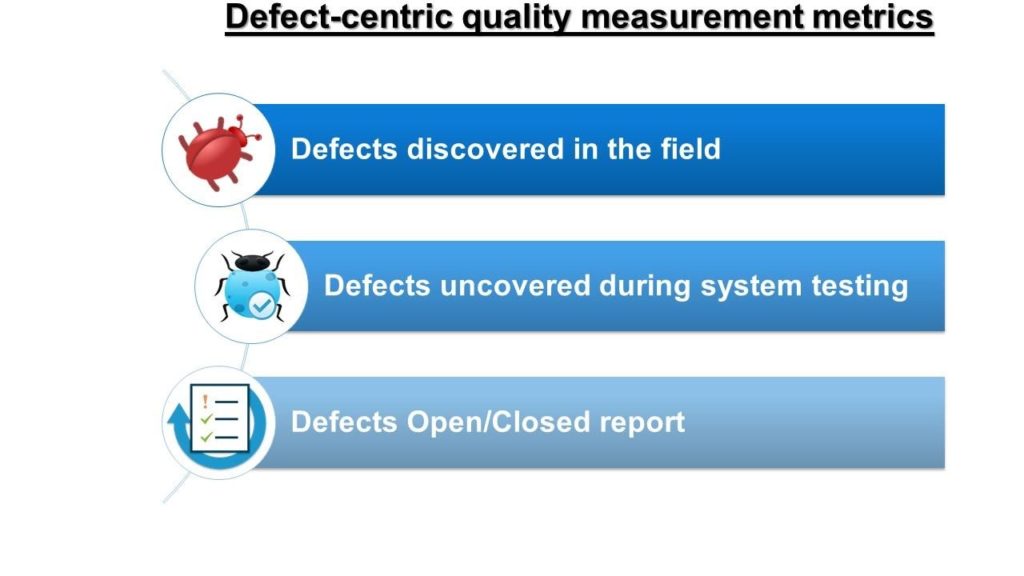
Defects discovered in the field
These are the defects found by users of the system and are reported back to the company. This metric sets the red flag because:
- Defects reported in the field are very expensive to triage and fix
- Users tend to report only severe defects
- When you start seeing a lot of severe defects from multiple customers it is too late to pay your technical debts
This metric is an indicator of major quality problems within the organization’s QA operations. It triggers a red alert that the quality management process needs a major overhauling. The process team, development team, and the QA need to swing into action to identify where they are lacking and address the problem areas, or in some cases completely revamp the process. However, this can often lead to a crisis management reactive culture that oscillates from a major focus on quality to lackadaisical as soon as the customer crises are handled. Ideally, QA operations need to be set on a solid foundation of quality goals.

Defects found during system testing
This metric can be an excellent predictor of lurking quality problems. However, it requires consistent and intense software testing to be carried out on the product or service for every new feature or change.
If the number of priority 1 defects being found is increasing, or the net defects found are increasing, it means that there is a major problem and if not nipped in the bud, it can cascade further into a major catastrophe. Sometimes, these bugs indicate that there might be underlying issues that need to be identified and addressed before it is too late.

Defect priority is a good indicator to understand the level of trouble. Sometimes, when measured over some time, the total number of defects might decrease. But, if high priority defects still exist despite the rectifications then it signals major problems somewhere in the design.
Defects Open/Close report
Another incredibly useful forward-looking metric is defects found versus defects fixed.
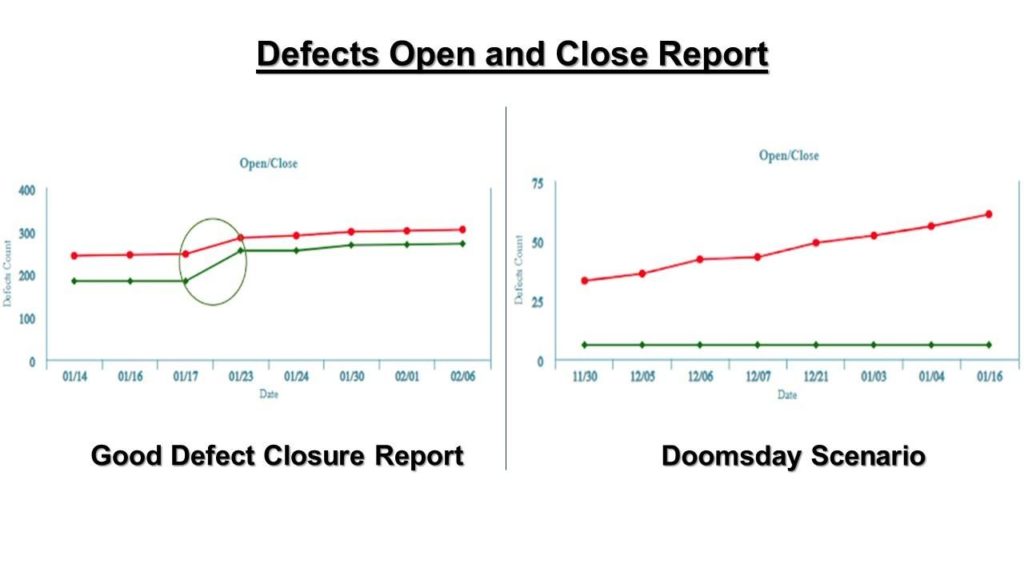
The two figures above show two different versions of an Open-Close report. Red indicates open defects and green indicates defects that are fixed by the teams.
In the first figure, the number of defects discovered during testing is increasing, but they are being fixed. At the circled point, the number of open defects dramatically drops. In an ideal world, the green and red lines would cross, but in reality, there are open defects when most software deploys. Thus, the key metric to watch for is the gap between defects found and defects fixed (that is how many open defects there are) and is that gap increasing or decreasing.
The next figure shows a doomsday scenario as there are absolutely no defects being fixed. Thus, the technical debt is increasing over time. If no action is taken before the software deployment the likelihood of an epic fail is high, particularly if there is a high number of priority 1 defects.
The basis of the defect metrics defined above presumes that comprehensive software functional testing, regression, and performance testing are carried out. Software regression testing is critical to the overall health of your software. If you don’t carry out regular software regression testing then you simply have no idea which direction you are headed in terms of quality. Also, if you are monitoring the metrics that are defined above, without a full software regression being carried out, the metrics are at best incomplete and at worst will give you an incorrect picture of your software quality.
Redefining quality with Webomates’ AI testing tool and Intelligent Analytics
Metrics like open close defect reports are an excellent forward predictor of the software quality of your product or service. Defect discovery as a function of time is a good predictor of software quality. Bugs found in the field is not a predictor – it’s a lagging indicator. However, for these metrics to work correctly, comprehensive software testing and analysis need to be done. Webomates provides testing as a service to this effect.
Controlling the frequency and the scope of testing is one of the key steps in conducting comprehensive testing. This helps in intercepting defects much earlier giving the teams enough time to fix and retest the defects.
The frequency part covers how often and when the testing is done for every change that triggers a build. However, conducting tests for every single change can be a daunting task. Webomates CQ does this effortlessly using the shift-left approach and various continuous testing methodologies that run using intelligent automation. It provides better accuracy in testing and the results are generated within a short period, approximately 15 mins to 1 hour.
Any changes in the scope of testing are handled by Webomates’ AI and ML algorithms which work on its self-healing test automation framework to dynamically adapt their testing scope to the changes.Now the question arises about whether a whole test suite needs to be executed or just a subset of tests specific to those changes. Our test optimization tool comes in handy in such scenarios and makes testing more efficient. AI Test Package Analyzer identifies all the test cases which are impacted due to a defect and traces them to impacted user stories/epics/requirements to identify the exact origin of the defect. This aids in understanding the root cause of the issue and appropriate action can be taken.
Webomates’ Intelligent Analytics provides insights that help in improvising your testing process by providing a continuous feedback loop of defects to requirements. Our AI defect predictor tool can predict defects earlier in the cycle, thus saving thousands of man-hours spent in triaging. The triaging reports are shared across the board with all the stakeholders giving them a detailed insight into what can be improved in terms of quality strategies.
If this has piqued your interest and you want to know more, then please click here and schedule a demo, or reach out to us at info@webomates.com. If you liked this blog, then please like/follow us Webomates or Aseem

Aseem, Founder & CEO of Webomates, created Webomates CQ, an AI-driven testing platform that cuts testing time by 10x with AiGenerate , and accelerates test maintenance by 10x using AiHealing, with guaranteed 24-hour execution. A multi-technical Emmy award winner with AI automation patents, he writes about AI-first testing and faster, simpler software delivery.
Tags: AI, AI Testing, Artificial Intelligence, Defect Triage, Test Automation
Leave a Reply